
 Kaleido
Thinking About Adding Digital Assets to Your Portfolio? 5 Things to Consider
The term "digital assets" may have once seemed like a futuristic concept, but times have changed quickly. In the past years, the financial world has...
The idea of portfolio diversification may seem obvious at first glance. Instead of investing all my money only in the shares or the bond of a single company, I can reduce my risk in case of bankruptcy of this company by investing in various other companies as well. Looking at these aspects a bit more holistically, portfolio diversification can not only help reduce overall risk but also potentially generate higher returns.
Even further, adding digital assets to an investment portfolio makes sense from various aspects.
In this article, we want to take a closer look at diversification. A central concept here is a correlation. Put simply, correlation measures the dependence of the returns of two investments. There are different ways to measure correlation, a relatively common one is to measure a coefficient, which is between -1 and +1. A value close to 1 (high positive correlation) indicates that two assets tend to move in the same direction at the same time, while a value close to -1 indicates that they move in opposite directions. A value around 0 indicates no correlation, i.e. no dependence.
If you put two assets with a low correlation close to 0 in a portfolio, you can assume that it is fundamentally less likely that if the price of one falls, the other will behave in the same way. Since the correlation is calculated based on time series, the result is correspondingly dependent on the time period of the data, which in turn opens up room for criticism.
The question that now arises is: how it looks in concrete terms when digital assets are added to a traditional portfolio. We have made an analysis based on the following key points:
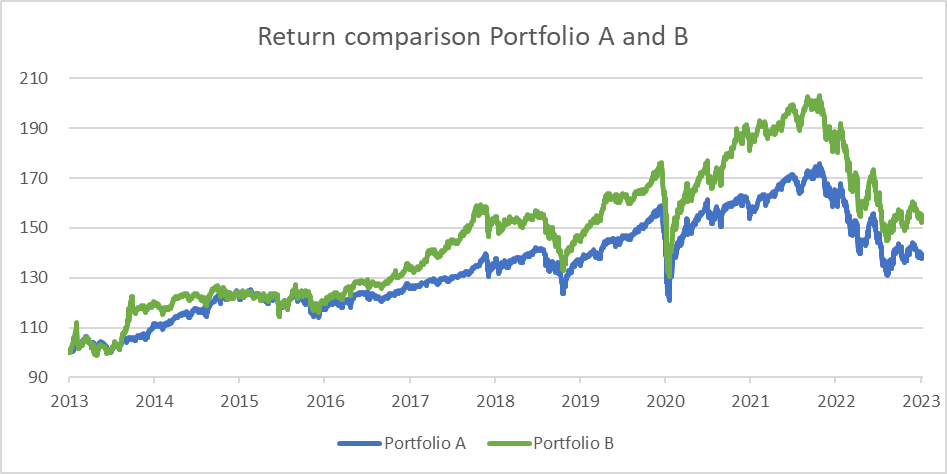
As the historical analysis shows, a classic 60/40 portfolio could achieve a return of 40.1% over time, whereas a constant five percent addition of Bitcoin since the beginning of the time series would have achieved a portfolio return of 64.5%. Interestingly, portfolio B has a maximum drawdown of -28.6%, which is only 3% more than portfolio A with -25.6%.
Comparing the annual returns achieved (minus the risk-free interest) with the risk, measured by the volatility of the portfolio, results in a Sharpe ratio of 0.47 in portfolio B compared to a Sharpe ratio of 0.36 in portfolio A. The additional risk assumed with the investment is only 3% lower than that of portfolio A with -25.6%. The additional risk assumed with the investment is thus rewarded with a disproportionately higher return in portfolio B.
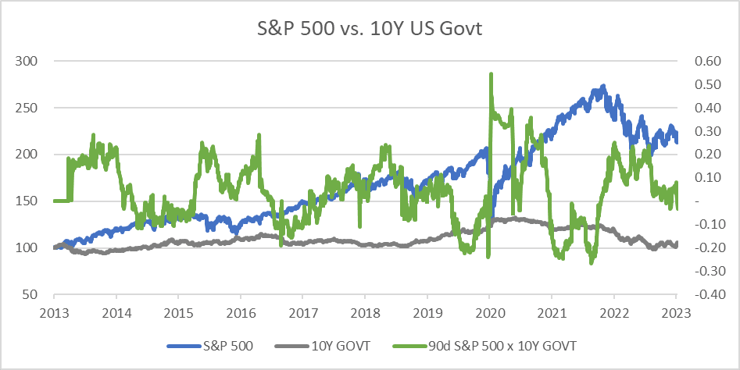
Over the past decade, the correlation between the S&P 500 Index and the indexed 10-year US government bond (10Y Govt) has ranged between -0.27 and 0.55 in each case.
We can make a similar observation with the correlation between shares and bitcoin. Here, too, we observe phases of different correlations, with the changes taking place on shorter time horizons. The correlation values between the S&P 500 and Bitcoin are between -0.3 and 0.57, i.e. in a similar range as bonds and equities.
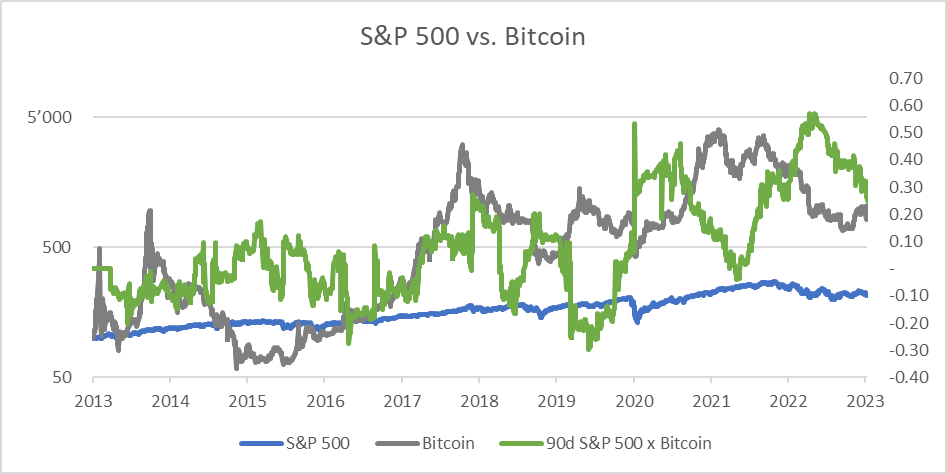
It is interesting to ask whether we have observed a regime change in the price development of Bitcoin in recent years. During the first two halving cycles [1] observed in this series of figures, from 2013 to July 2016 and from July 2016 to May 2020, the correlation was more often negative, and if positive, then significantly lower than in the current halving cycle since May 2020. This question obviously cannot be answered definitively, but it also allows the thesis that liquidity is the decisive factor in the end. Due to the growth of the Bitcoin network and the associated adaptation by numerous users, the price of the asset has also risen. This obviously led to a higher market capitalization and thus also to greater liquidity.
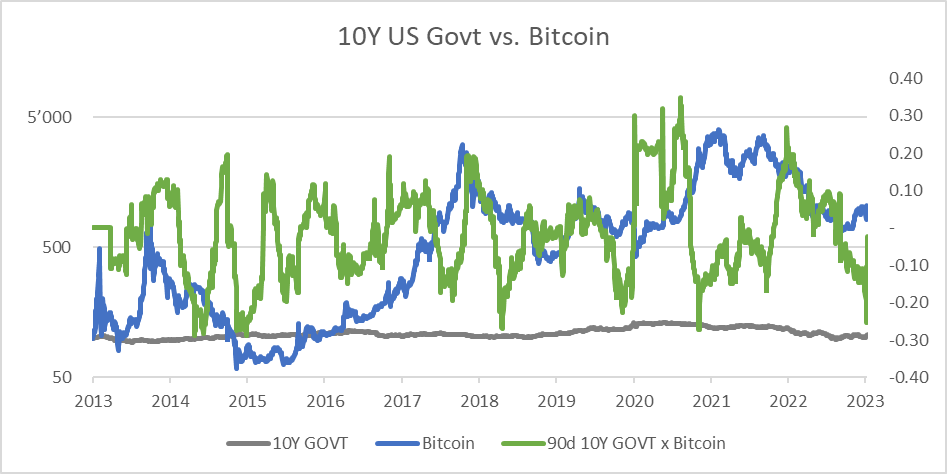
As a next step, let's focus on the correlation between bonds and Bitcoin. Here we also observe relatively rapid swings between positive correlation values and negative ones. While the lowest value, as in the other two comparisons, is -0.29 (vs. -0.27 and -0.30), the correlation between bonds and Bitcoin reaches a maximum value of just +0.35.
Diversification of a portfolio is undoubtedly a basic prerequisite for long-term success and at the same time for mitigating various risks. But are digital assets like Bitcoin suitable for diversification?
As the above analysis has shown, adding digital assets to the portfolio offers added value in terms of correlation because it generally has low values, some of which are uncorrelated, close to 0, or even negatively correlated.
Furthermore, the historical portfolio analysis shows that an addition of Bitcoin could at least historically make a significant contribution to a higher return, while the risk increased only slightly. Of course, there is no guarantee that this will also be the case in the future but the two other arguments described at the beginning, return potential and investment in the future, certainly play a possible motivation.
The issue of decentralization also plays an important role nowadays and in the future. Digital assets can be stored outside the traditional financial system due to the possibility of self-custody and offer diversification from exposure to states and central banks.
Bitcoin can also be an alternative or complement to gold as an insurance asset. Both assets have no counterparty, which is diametrically different from equities and bonds.
Form your own opinion and do not hesitate to contact us if you have any questions.
[1] The halving cycle describes the approximately four-year period after which the reward for the Bitcoin miner who added the block to the chain is halved.

The term "digital assets" may have once seemed like a futuristic concept, but times have changed quickly. In the past years, the financial world has...

Wealth planning means managing an individual's or family's financial affairs to achieve long-term financial goals. When we put it this way, it sounds...

On August 9, 2011, the market cap of Apple exceeded Exxon for the first time in history. The development of the two companies and their respective...