
 Patrick Fehr
The upcoming Ethereum Merge and ways to profit
The Ethereum blockchain is about to undergo arguably the most significant upgrade in the chain's roughly eight-year history. Ethereum is the second...
On August 9, 2011, the market cap of Apple exceeded Exxon for the first time in history. The development of the two companies and their respective sectors couldn’t have been more diverging, until recently. Apple and Tech in general experienced an unprecedented value creation, culminating in five companies with a market capitalization of more than one trillion USD as of March 2022. Annualized returns from August 2011 to December 2021 for Apple and the tech sector have been a staggering 30.2% and 23.6%, respectively. Exxon and its fellow Energy companies didn’t embark on a particularly successful journey over the same period, with the trough probably being Exxon’s removal from the Dow Jones Industrial (one of the world’s most regarded equity index) in the summer of 2020. Exxon was a member for 92 years. Ironically, it outperformed the DJI by 90% since its removal.
US Tech companies rule the world
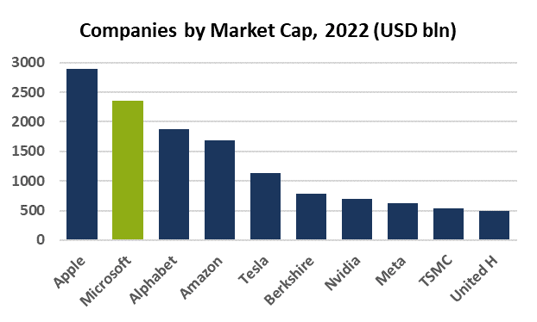
Every cycle generates its darlings and high-flyers. When looking at the 10 biggest market cap companies worldwide today, we get the following names (excluding Saudi Arabian Oil Co due to its limited free float):
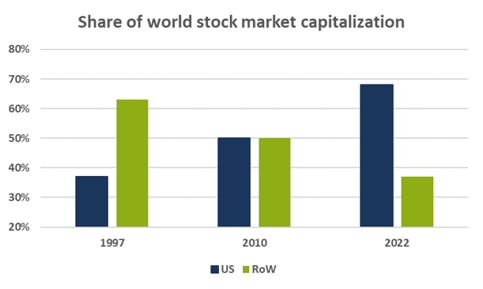
The list is very much tech-dominated, and very much US-dominated. This is not a surprise given the fact that the MSCI US sports a market cap of 40 trillion USD and dwarfs the MSCI World ex-US, which is at only 19 trillion USD resulting in a US share of 68%. This gap marks an all-time wide. The US share of the world market cap was 50% in 2010 and 37% in 1997, respectively.
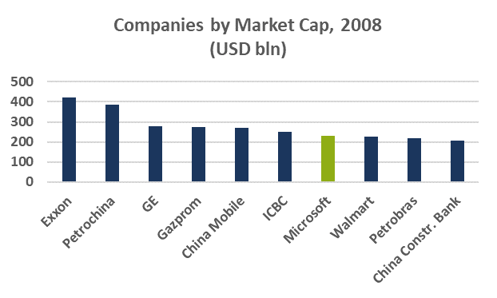
Let’s go back to the Mega Cap companies and look at the last cycle when it peaked in 2008. The biggest companies at that time were:
Looking back, this was not a big surprise because oil was trading at 150 USD per barrel at that time. We could continue and find Cisco, Nortel and Lucent in early 2000 and lots of Japanese companies in 1990. What’s the point of doing this exercise? The takeaway is the fact that equity markets tend to extrapolate. This can lead to unsustainable high multiples, excessive revenue, earnings expectations, and pronounced herding. A side effect of the latter is a diminishing diversification effect of major indices. At the end of 2021, the top ten stocks of the S&P 500 accounted for 30.5% of the index and were equal in weight to the bottom 408 stocks. For reference: in 2010 the numbers were 18.7% and 225, respectively. If you buy an ETF for its diversification effect, you may want to consider an equal-weighted product.
Once a cycle has peaked, the leaders make room for a new breed of high-flyers. Also, they don’t do too well in the subsequent ten-year period. The “Class of 2008” averaged an annualized return of 0.93% from 2008 to 2018, this compares to 7.62% for the MSCI World. That’s a relative underperformance of 6.68% per year and four of the ten members produced even negative returns. Let’s look back a bit longer to the “Class of 2000” (comprising 8 US companies and one each from Japan and the UK). GE, Cisco, and Intel were the top three market cap firms, Microsoft was also represented. The entire group returned a negative 6.36% from 2000 to 2010 per year. Only three of the constituents generated positive returns for this period. The group underperformed the MSCI World by 6.90% annualized.
History doesn’t repeat, but it rhymes
Of course, we don’t know if this cycle has peaked, is peaking, or whether it has legs, so let’s do an extrapolation: If Apple shares were to appreciate 8% annually for the next ten years, the market capitalization of the company would reach a bit more than six trillion USD (that’s 20% higher than Japan’s Gross Domestic Product). Would Apple trade at 30x earnings? If so, this would require a net profit of 200 billion USD, up from 94 billion USD in its Fiscal Year 2021. Big numbers, indeed. Apple, Google and other Big Tech companies reached a dominance, it is perhaps hard to imagine that these companies could lose relevance. Even if they will be able to retain dominant market positions, that does not make them necessarily great stocks to invest in going forward. Will these companies be able to maintain super-normal profit margins? Advertising spending (the backbone of Google’s and Meta Platform’s revenues) is cyclical, smartphone shipments from 2015 to 2021 increased by only 6% annualized. And we haven’t even discussed potential headwinds from a change in the regulatory regime. History doesn’t repeat, but it rhymes. We wouldn’t be surprised to see new leaders emerging in the future.
Source:
Bloomberg (2022)

The Ethereum blockchain is about to undergo arguably the most significant upgrade in the chain's roughly eight-year history. Ethereum is the second...

Blockchain technology has been the talk of the town for the past few months: Suddenly people were interested in the distributed database as well as a...

"I call for the greatest peacetime commitment of funds and resources in our nation's history to develop America's own alternative fuel sources." -...